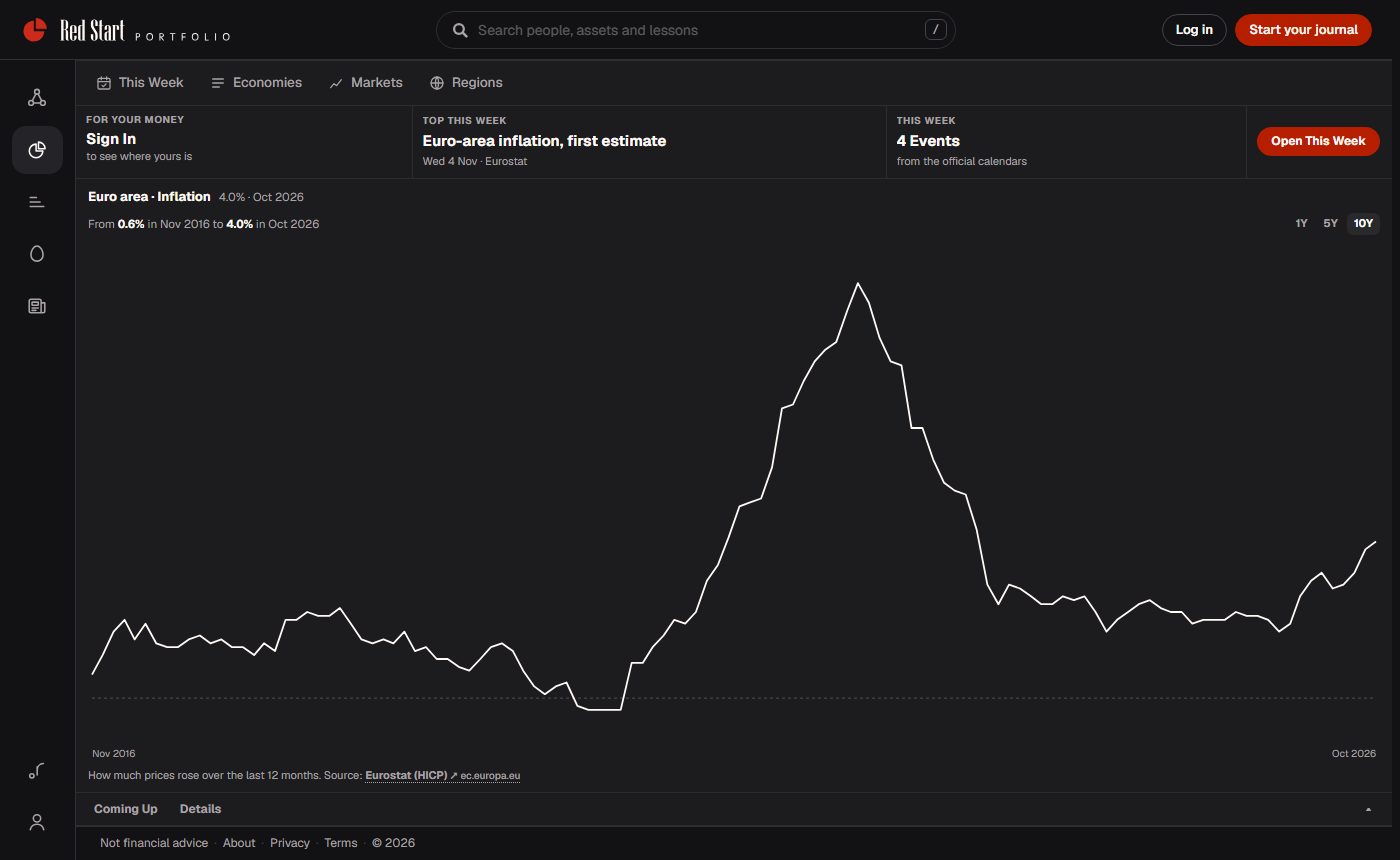
Getting started
Portfolio
Your investments in one place, and the questions they answer: how am I doing, how spread out, how bumpy, what does it cost.
Pictures from October 2026, with a made-up portfolio. Portfolio’s look moves on; the steps stay the same.
- Open Portfolio →
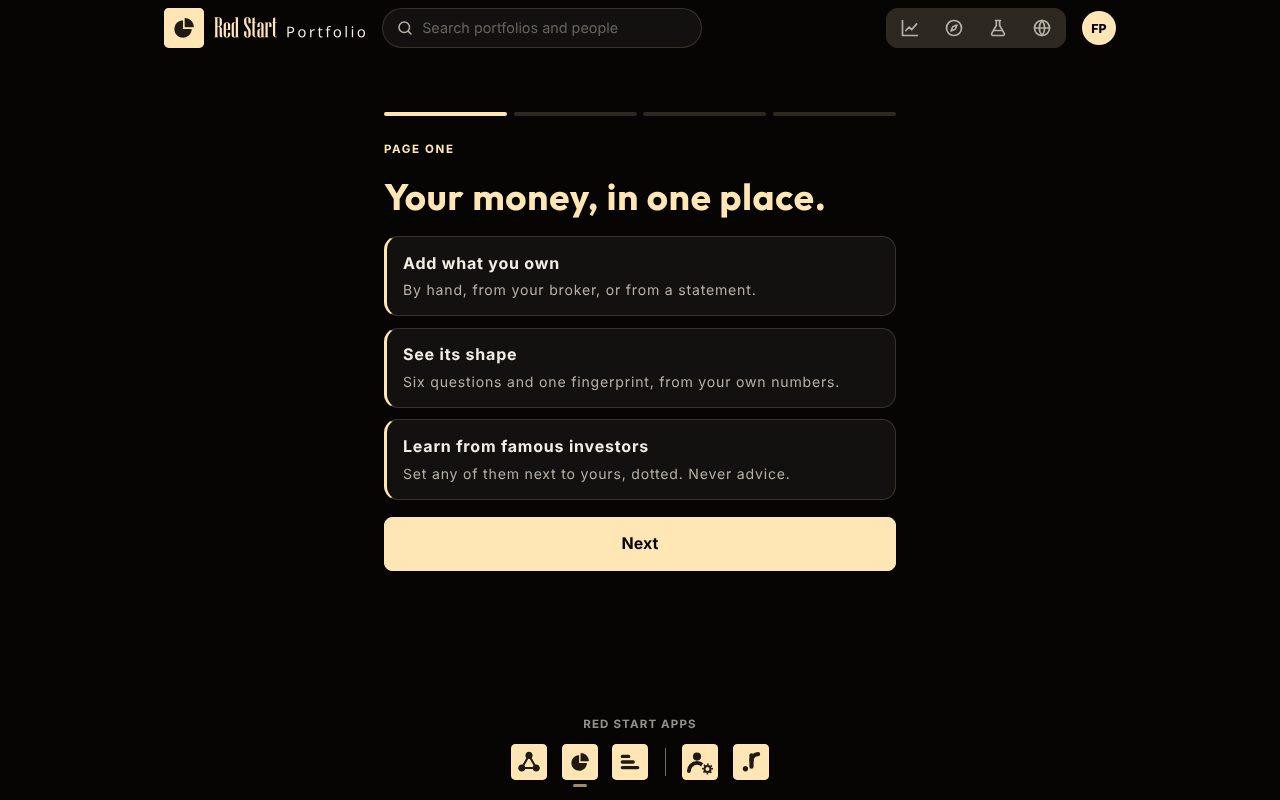
Sign in once, then three short pages
One Red Start account opens every app. Portfolio then asks two things: private or public (private unless you choose; others only ever see percentages), and a @handle, which you can skip.
Your Overview, empty
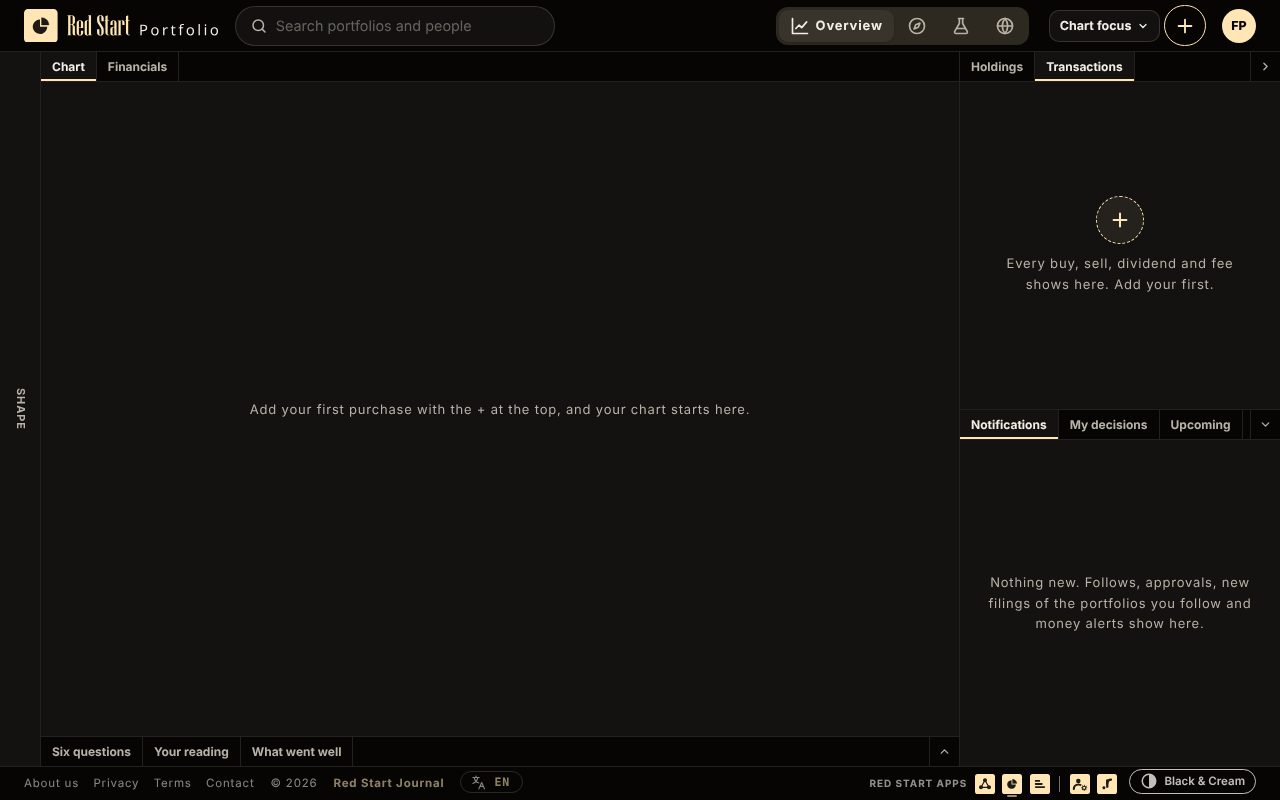
Four pages sit in the header: Overview (yours), Discover, Lab and World. Overview opens on the chart, with your transactions beside it. Everything starts with the + at the top, or the + inside Transactions.
Press +: three ways in
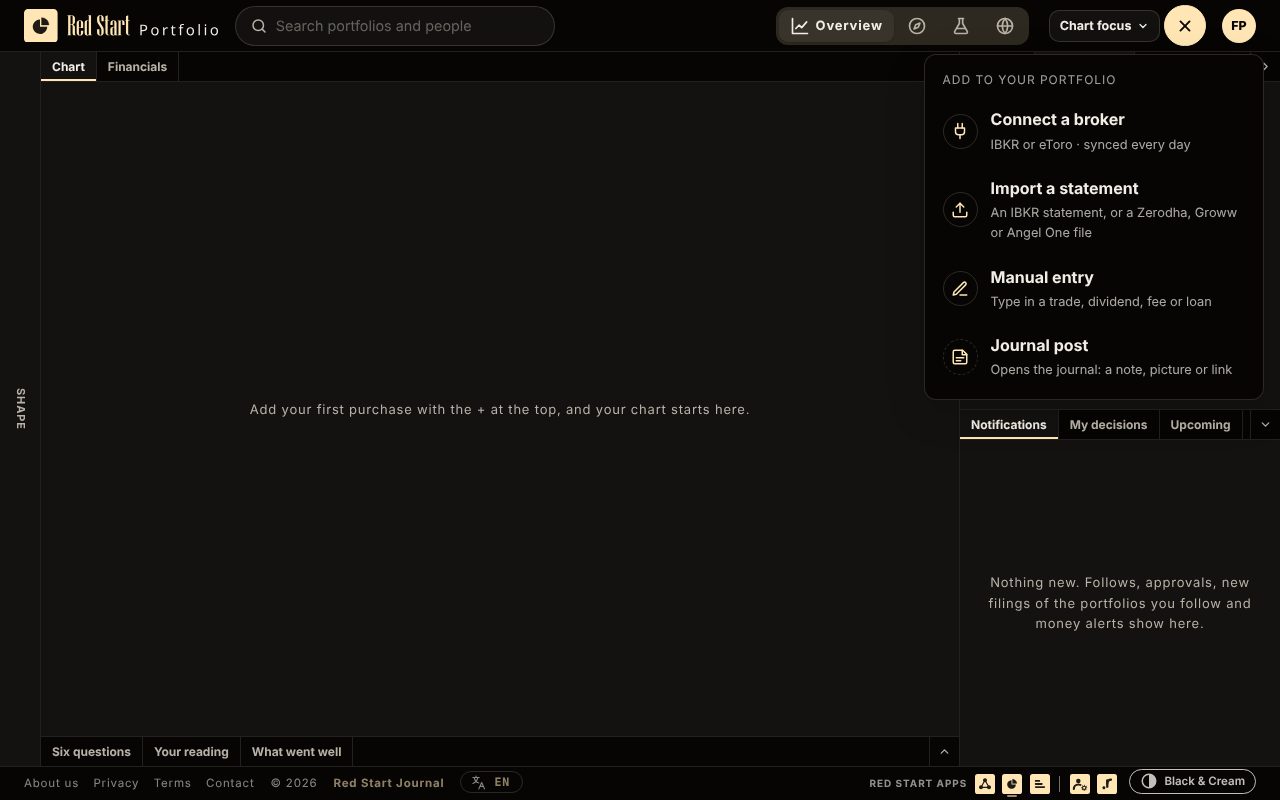
Connect a broker (it then syncs every day by itself), import a statement file, or type a trade in. A fourth item opens Connect to write a journal post.
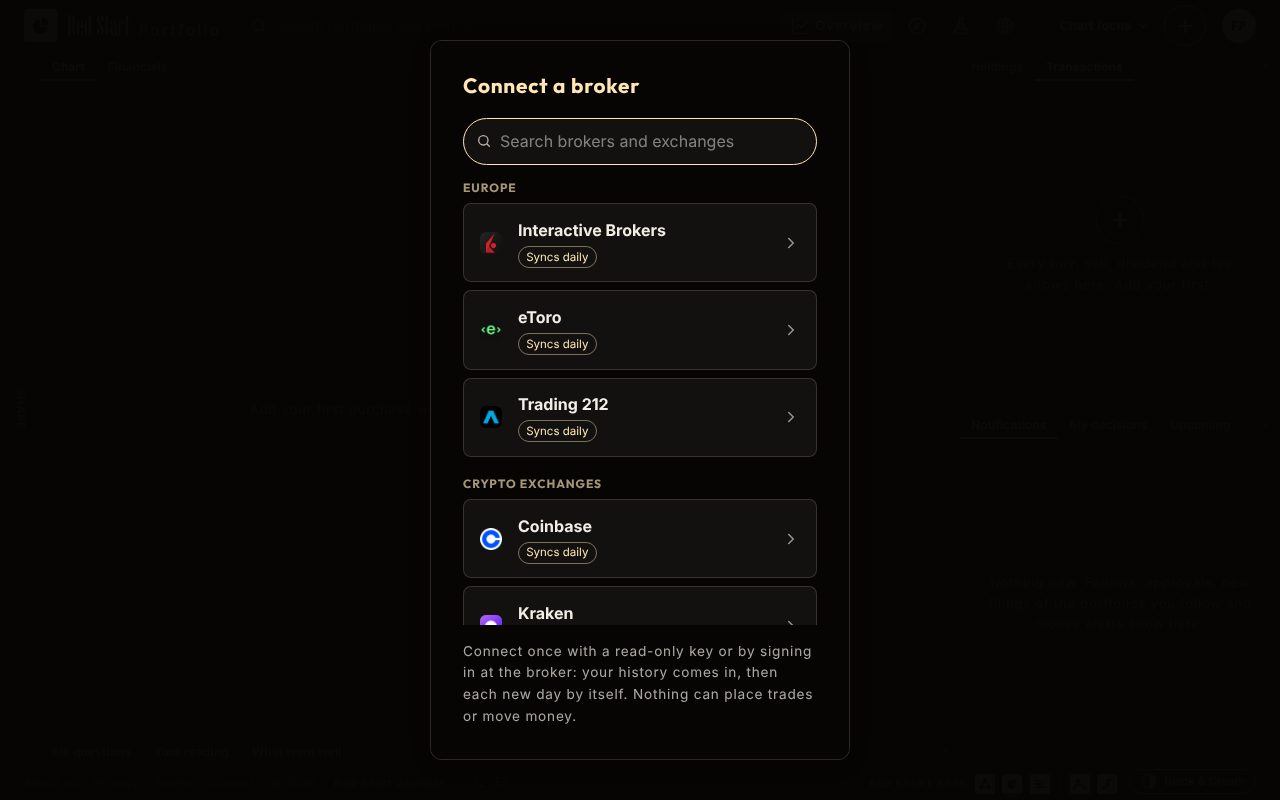
Connect your broker once
Pick your broker from the list (search it by name). You make a read-only key at the broker and paste it: Portfolio can read your history but never trade or move money. Your whole history comes in, then each new day by itself.
Where to click
- Interactive Brokers
- Client Portal → Performance & Reports → Flex Queries: create an Activity Flex Query and note its Query ID, then Flex Web Service Configuration → Generate New Token. Paste both.
- eToro
- On the eToro website: Settings → Trading → API Key Management → Create New Key (Real, Read only). Paste both keys.
- Trading 212
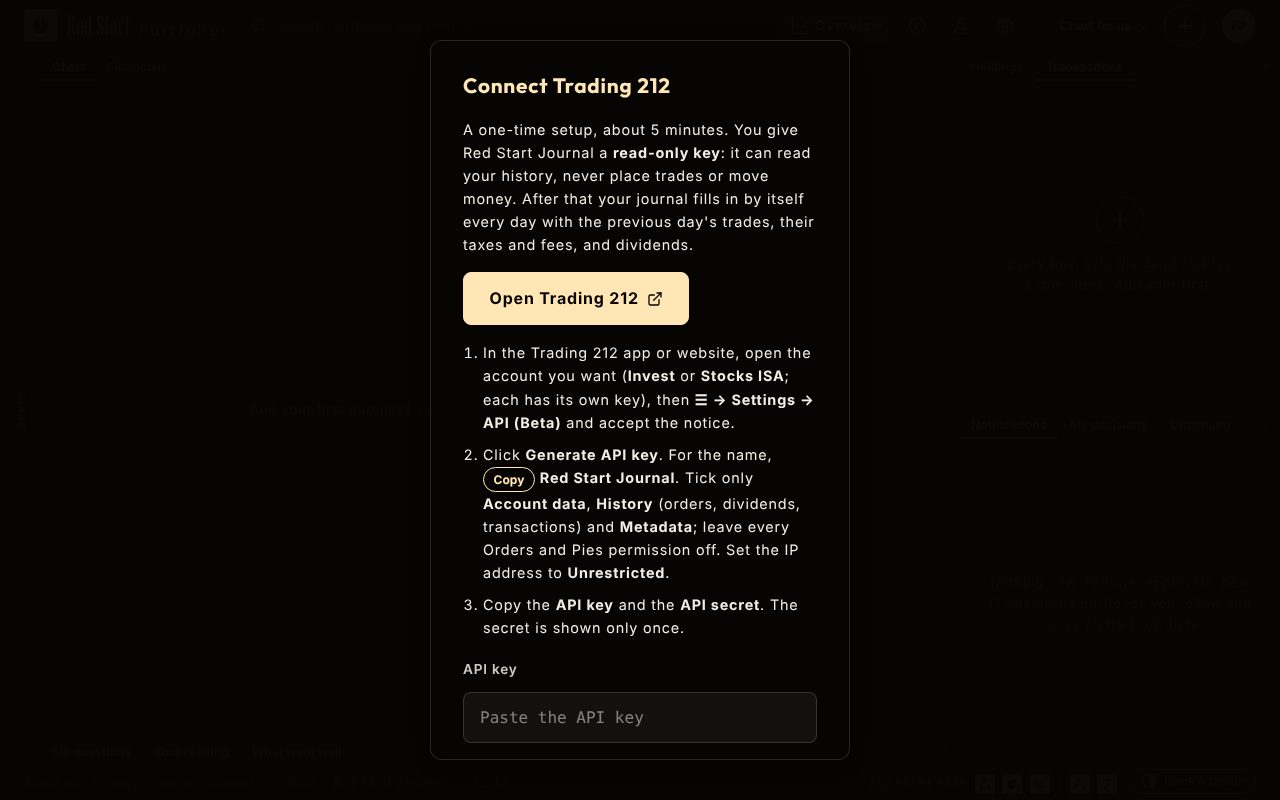
- ☰ → Settings → API (Beta) → Generate API key: tick Account data, History and Metadata only, IP unrestricted. Paste the key and the secret.
- Kraken
- Settings → API → Create API key with Query Funds, Query Closed Orders & Trades and Query Ledger Entries only.
- Bitvavo, Coinbase, OKX, Bybit
- Each in its API settings, with Read (View) permission only. Portfolio shows the exact steps for each.
The key, step by step
Each broker’s screen shows its own steps, with a button that opens the broker beside Portfolio. Paste what you copied and press Connect: the years come in one by one while you watch.
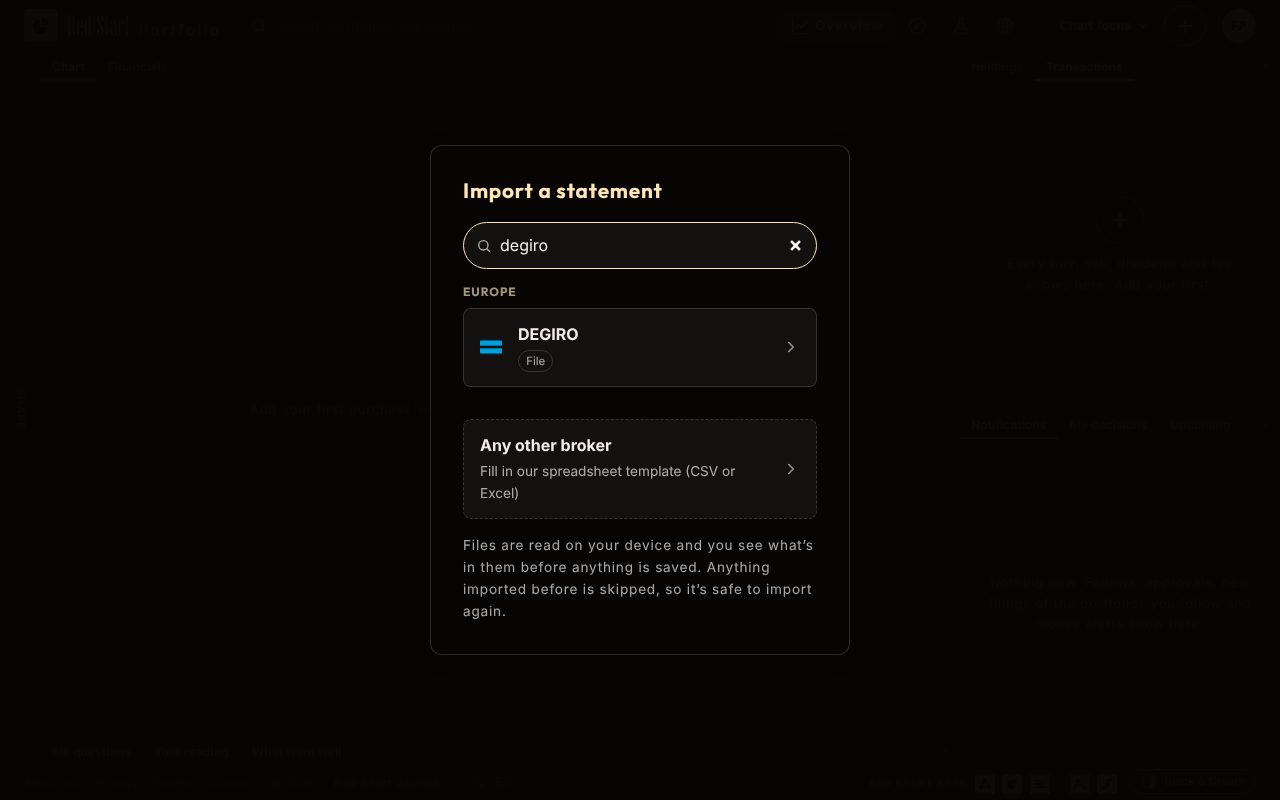
Or import a statement file
Search your broker, download the file it names (CSV, Excel or PDF), and choose it. The file is read on your device; you see what is in it before anything is saved, and importing it again adds nothing twice.
Where to click
- DEGIRO
- Inbox → Account Overview → Export → CSV (the file with dividends and fees), and Inbox → Transactions → Export → CSV.
- Trading 212
- History → download icon → Export history (a year per file).
- Trade Republic
- Profile → Statements → Transaction export (CSV), or a trade’s own PDF.
- Scalable Capital
- On the website: Broker → Transactions → Export.
- Revolut
- Invest → More → Documents → Account statement, as Excel.
- Zerodha
- Console → Reports → Tradebook, Equity, as CSV.
- Groww
- Profile → Reports → Stocks → Order history, as Excel.
- Angel One
- Account → Trades and charges → Download trade history.
- Any other broker
- Download Red Start’s template from the import screen, fill in one row per buy, sell, dividend or fee, and choose it.
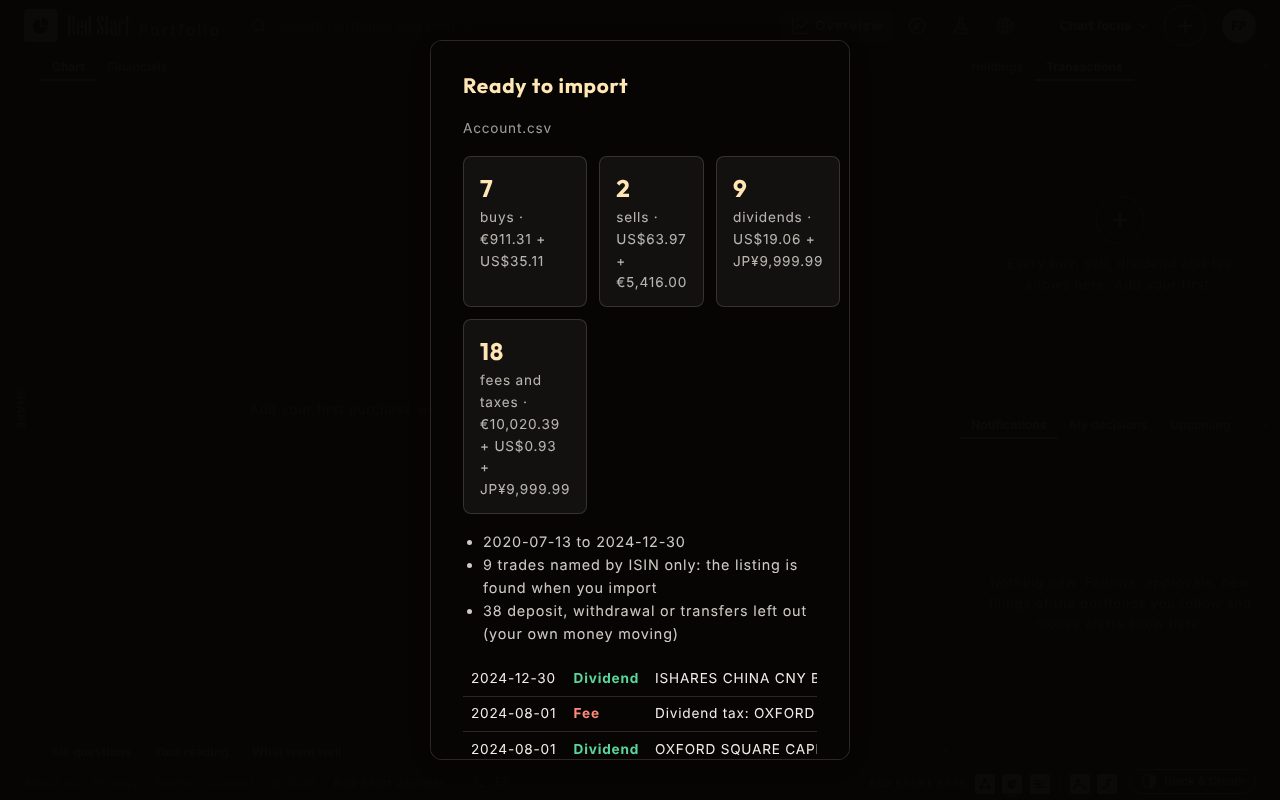
Check the preview, then import
Buys, sells, dividends and fees are counted, each in its own currency. Shares named only by their ISIN get their listing when you import, so their prices follow.
Or type a trade in
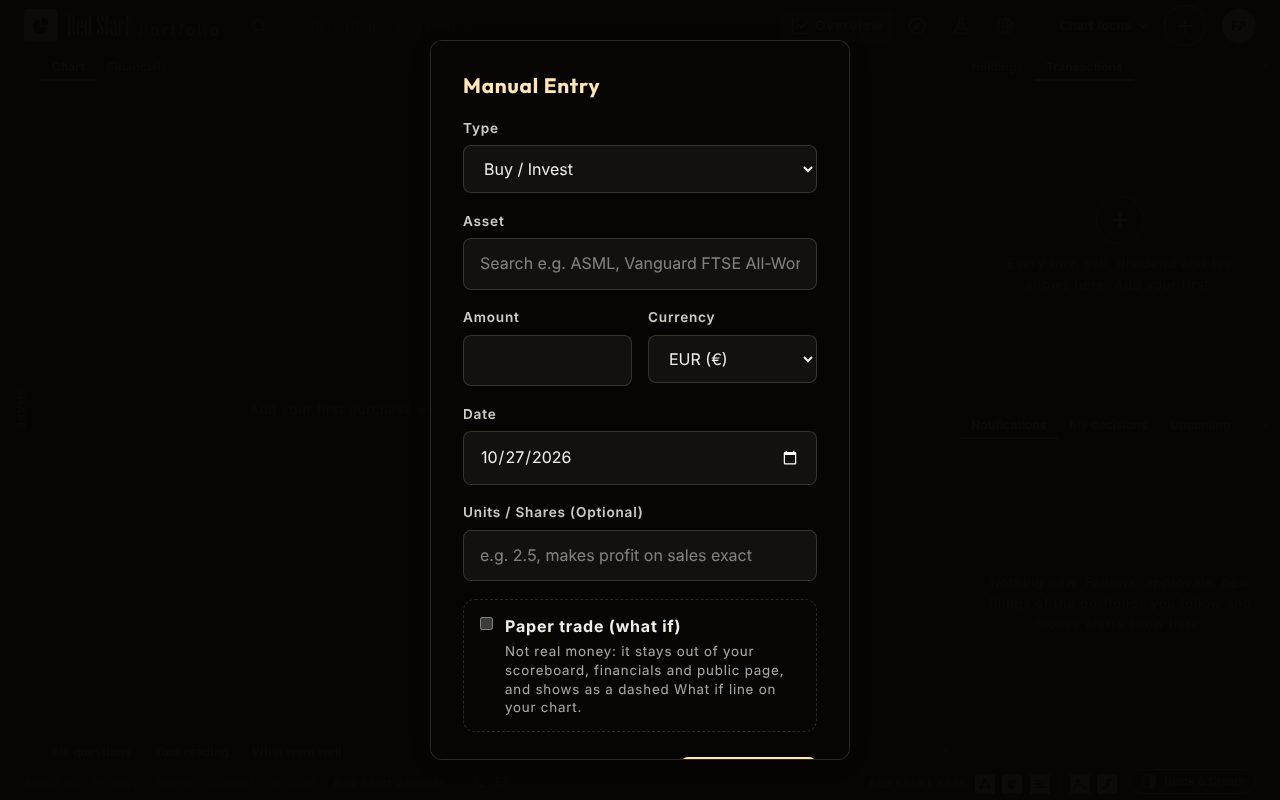
Manual entry: pick the asset from the list, the amount, the date, and the units if you know them. Tick “Paper trade” to try a what-if that never counts as real.
- Open Overview →
Read your Overview
The row over the chart holds the big numbers: net worth, today, total profit, the yearly rate (XIRR), dividends and fees. The chart switches between value, money in, a calendar, falls and income. Transactions stay beside it.
Switch the workspace
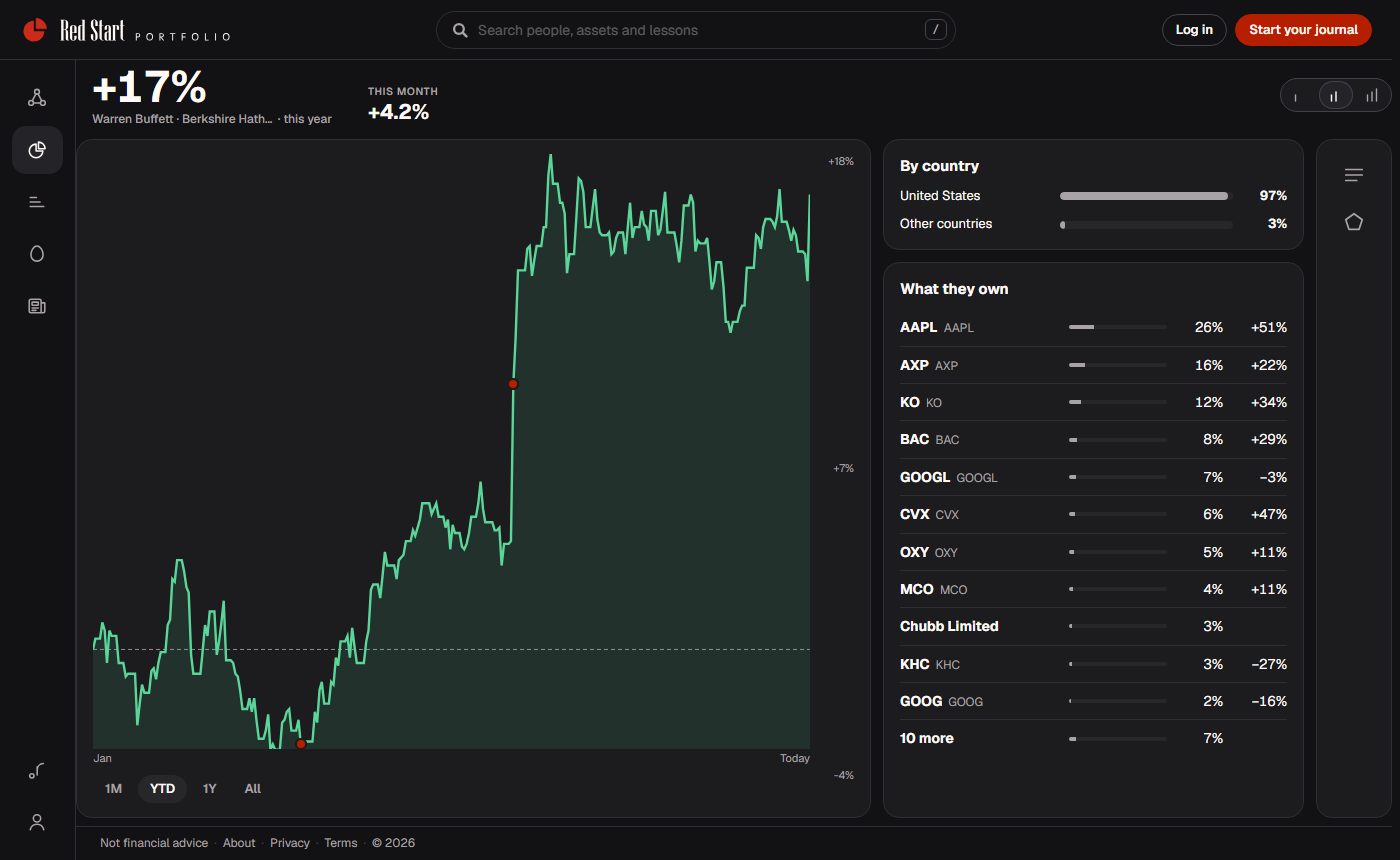
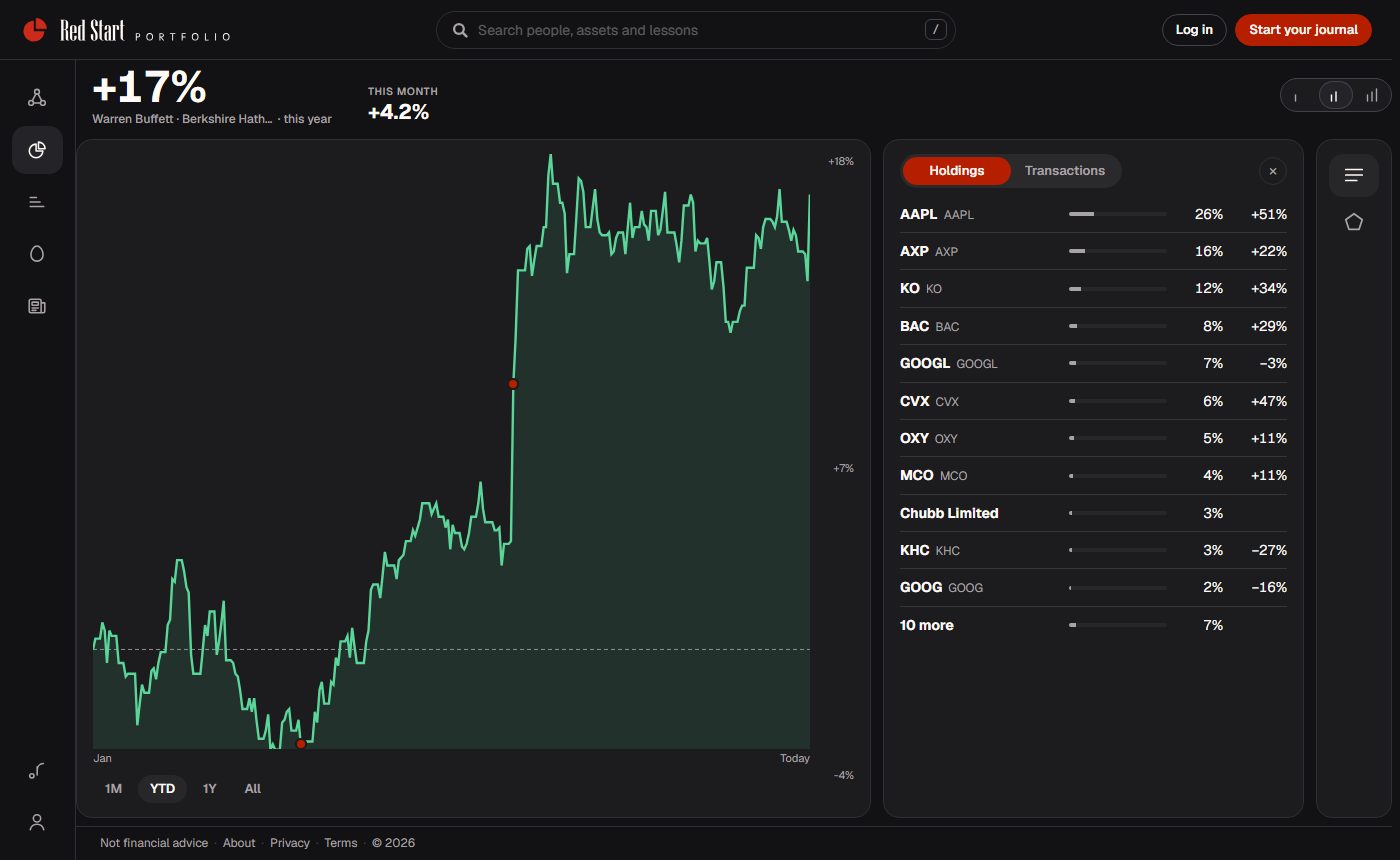
The menu next to + changes the whole arrangement. Chart focus shows the chart; Essentials opens everything: your Shape, Risk, Income, Holdings, the Six questions and more. The arrow at the end of a side column’s tabs docks it to the edge (Ctrl + B and Ctrl + Alt + B do the same); drag a tab to move it.
Everything at once: Essentials
Left, the shape of your money and how bumpy it is; middle, the chart with the Six questions under it; right, holdings and transactions, then notifications, decisions and what is coming up.
- Open Discover →
Discover: compare with others
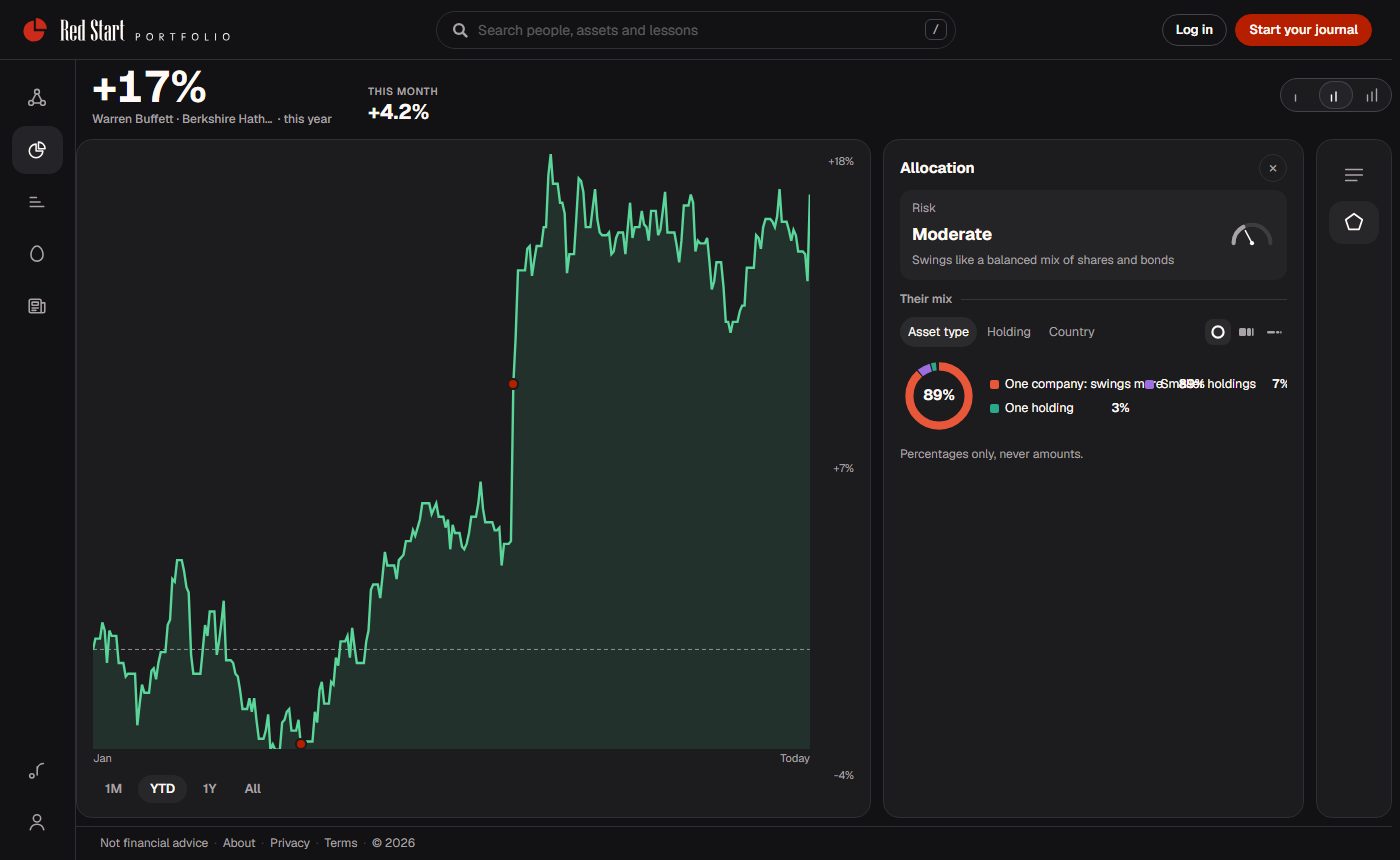
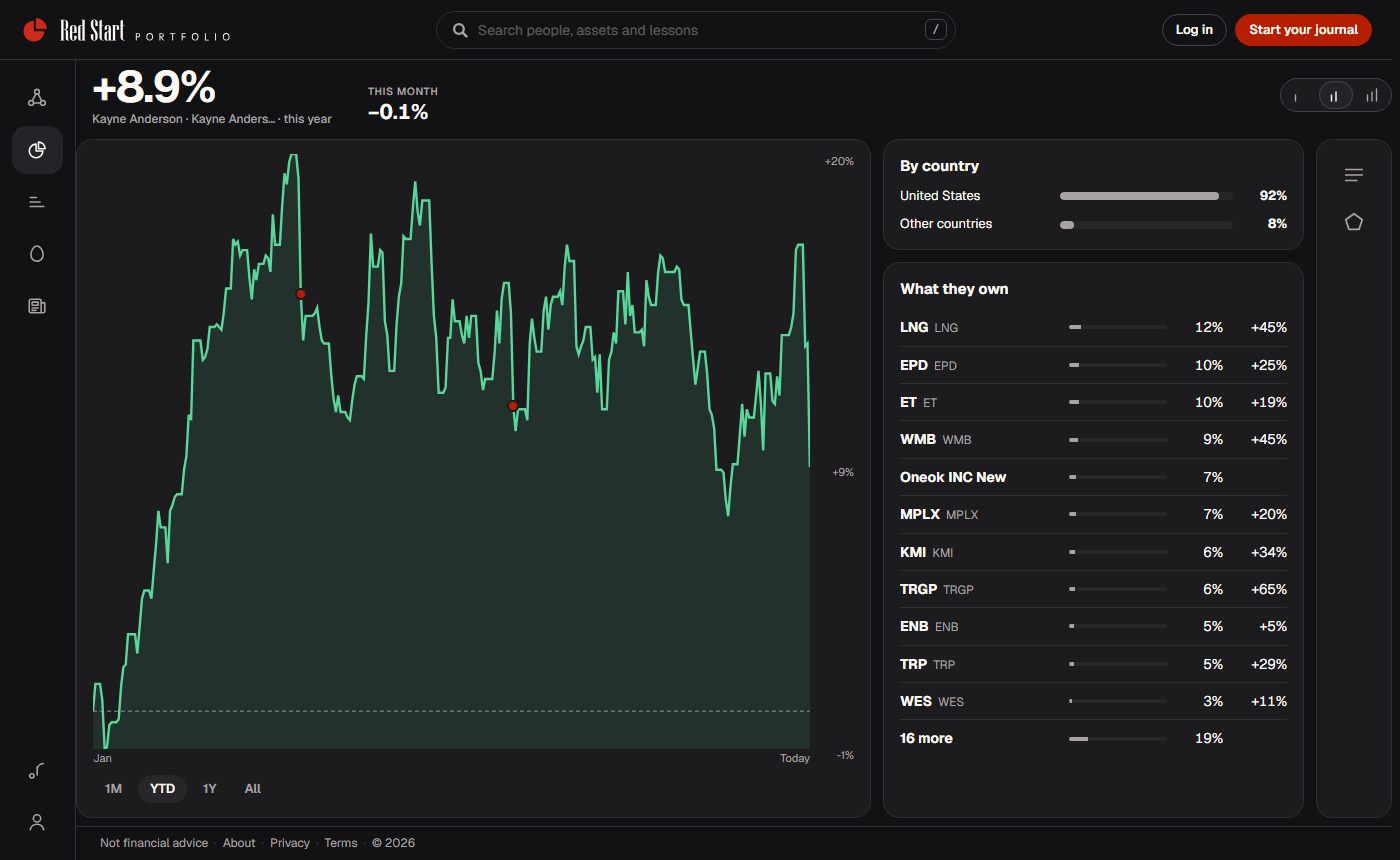
Set your portfolio next to a famous investor’s or a member’s: return on the money put in, the shape side by side, the mix side by side. Percentages only, never amounts, and never advice.
- Open the Lab →
Lab: try an idea on real prices
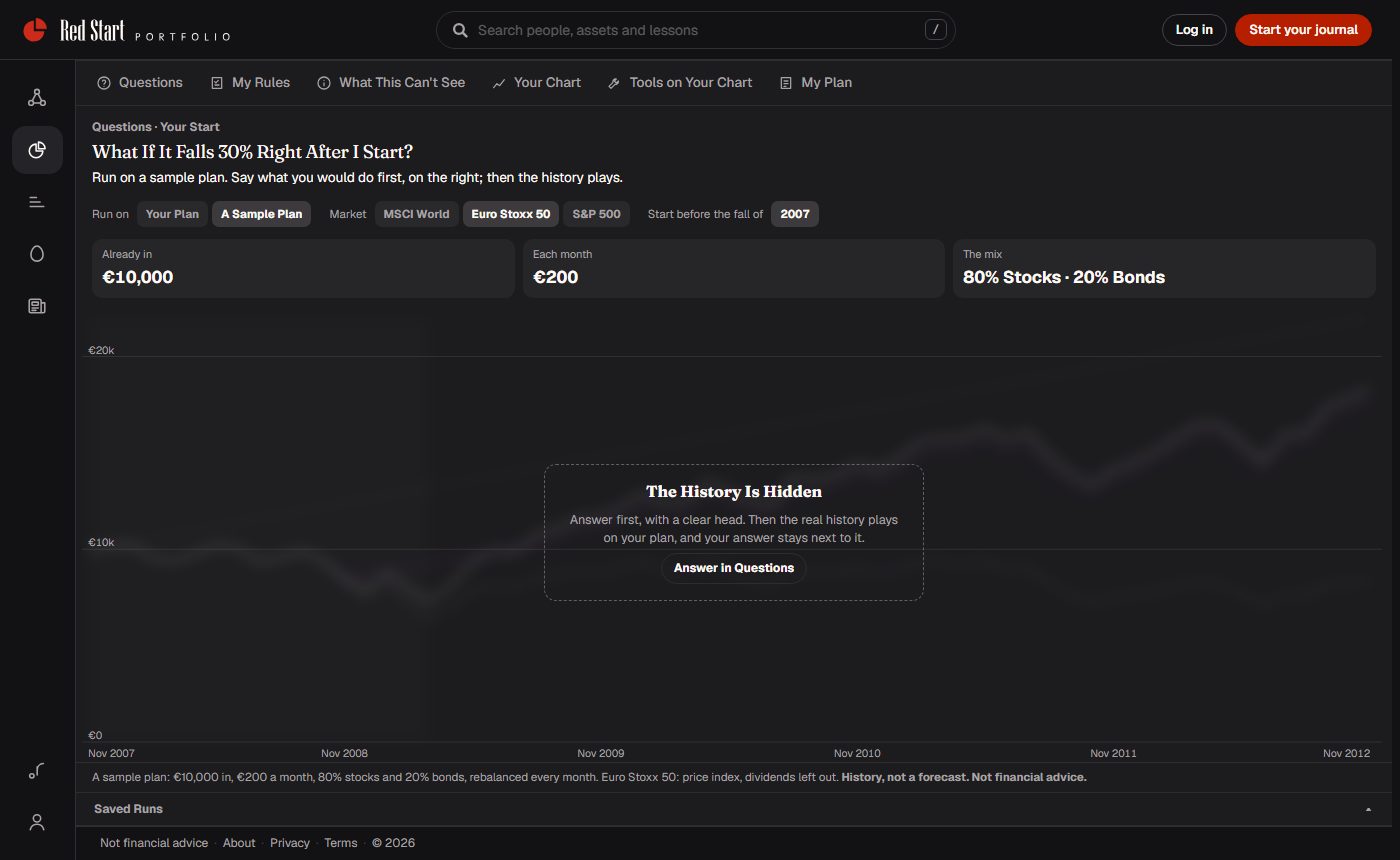
Backtest a mix, see what panic would have cost, or all-at-once against every month. Nothing is traded; note what you learn as a decision.
- Open World →
World: the economies around your money
Inflation, policy rates, growth and markets, with the regions you own first. Tap any number for its last ten years, and News for the stories behind it.