What 1% a Year Costs Over 30 Years. The same €10,000 on two paths. Example returns, not a forecast.
One Sum, Two Paths.
- Put in €10,000, once, at the start.
- It grows 6% a year, before costs, for example.
- Costs take 1% a year, so you keep 5%.
- Wait 30 years, no money added.
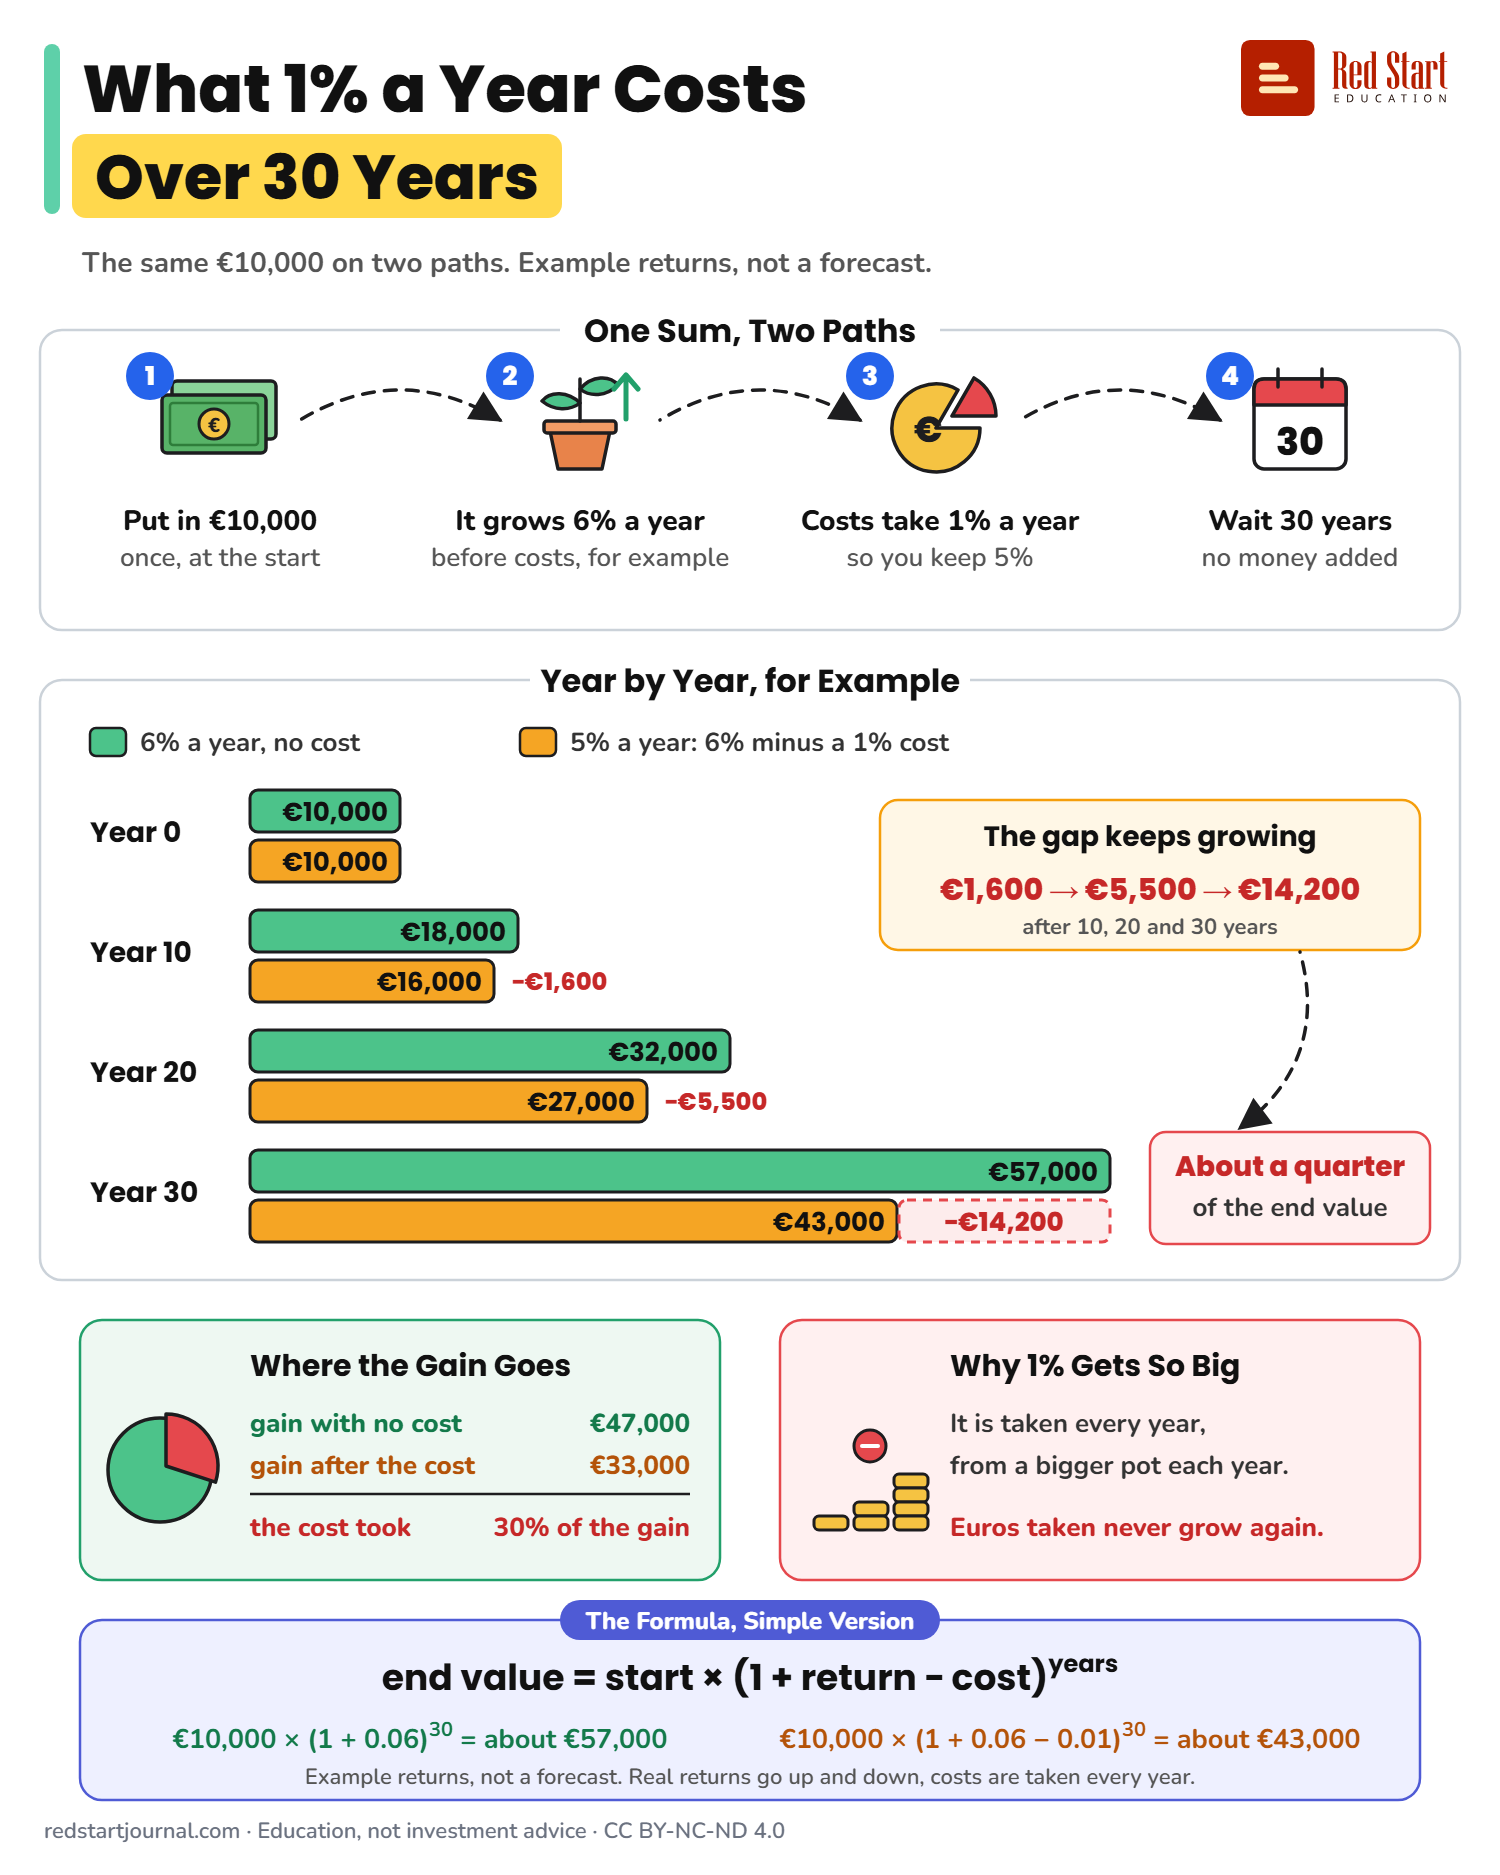
Year by Year, for Example. Green: 6% a year, no cost. Orange: 5% a year: 6% minus a 1% cost.
Year 0: €10,000 and €10,000.
Year 10: €18,000 and €16,000, a gap of €1,600.
Year 20: €32,000 and €27,000, a gap of €5,500.
Year 30: €57,000 and €43,000, a gap of €14,200.
The gap keeps growing: €1,600, then €5,500, then €14,200, after 10, 20 and 30 years. About a quarter of the end value.
Where the Gain Goes. Gain with no cost: €47,000. Gain after the cost: €33,000. The cost took 30% of the gain.
Why 1% Gets So Big. It is taken every year, from a bigger pot each year. Euros taken never grow again.
The Formula, Simple Version. End value = start × (1 + return − cost) to the power of years.
€10,000 × (1 + 0.06) to the power of 30 = about €57,000.
€10,000 × (1 + 0.06 − 0.01) to the power of 30 = about €43,000.
Example returns, not a forecast. Real returns go up and down, costs are taken every year.
redstartjournal.com · Education, not investment advice · CC BY-NC-ND 4.0